GetDist GUI
GetDist provides two graphical user interfaces: the original Qt-based GUI and a newer Streamlit-based web interface.
GUI Application
Pre-built standalone applications are available for Mac and Windows platforms.
Mac: The Mac app is distributed as a DMG file. Simply download, mount the DMG, and drag the app to your Applications folder.
Windows: The Windows app is distributed as both an MSI installer
You can download the latest versions from the GitHub releases page. These applications do not require Python or any dependencies to be installed.
The GUI allows you to open a folder of chain files, then easily select, open, plot and compare, as well as viewing standard GetDist outputs and tables.
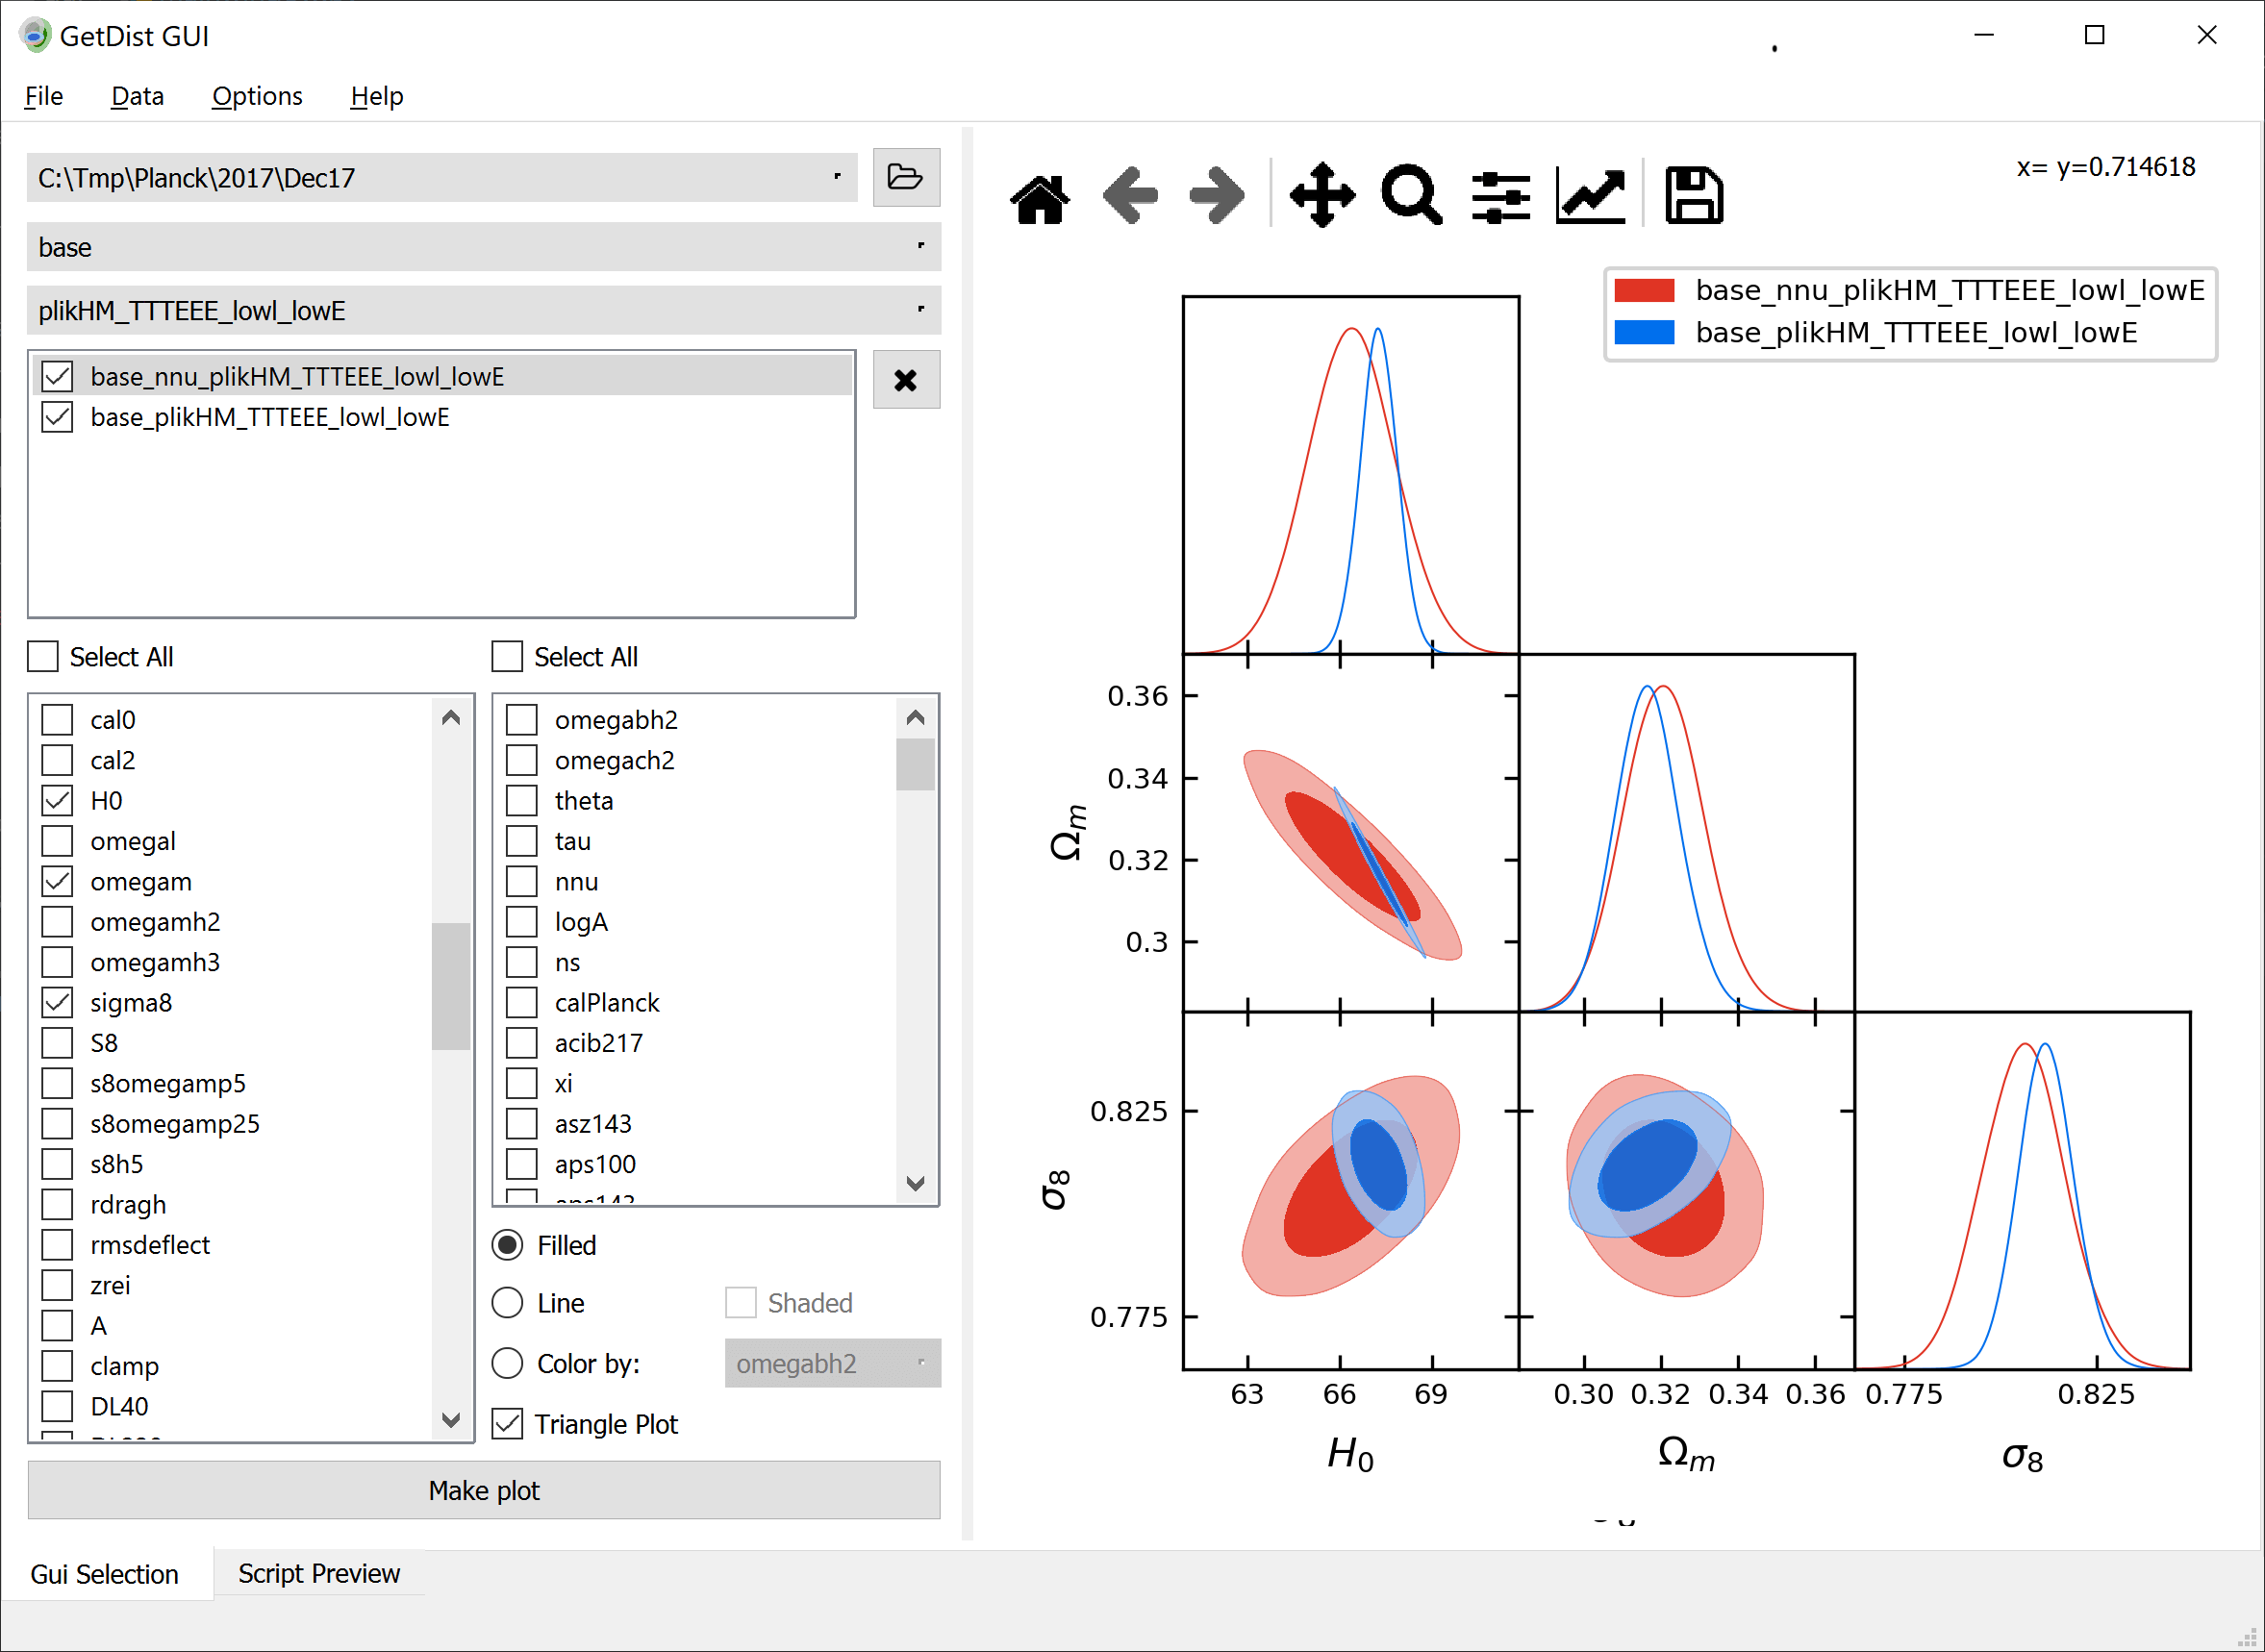
It can open chain files under a selected directory structure (and also paramgrid directories as show above, or Cobaya grids). See the intro for a description of chain file formats. A grid of sample chains files can be downloaded here, after downloading a file just unzip and open the main directory in the GUI.
After opening a directory, you can select each chain root name you want to plot. It is then added to the list box below. The selected chains can be dragged and dropped to change the order if needed. Then select the parameter names to plot in the checkboxes below that, and correspond to the names available in the first selected chain.
The Gui supports 1D, 2D (line and filled), 3D (select two parameters and “color by”), and triangle and rectangle plots.
Script preview
Use the option on the File menu to export a plot as-is to PDF or other image file. For better quality (i.e. not formatted for the current window shape) and fine control (e.g. add custom legend text, etc), export the script, edit and then run it separately. The Script Preview tab also gives a convenient way to view the script for the current plot, and preview exactly what it will produce when run:
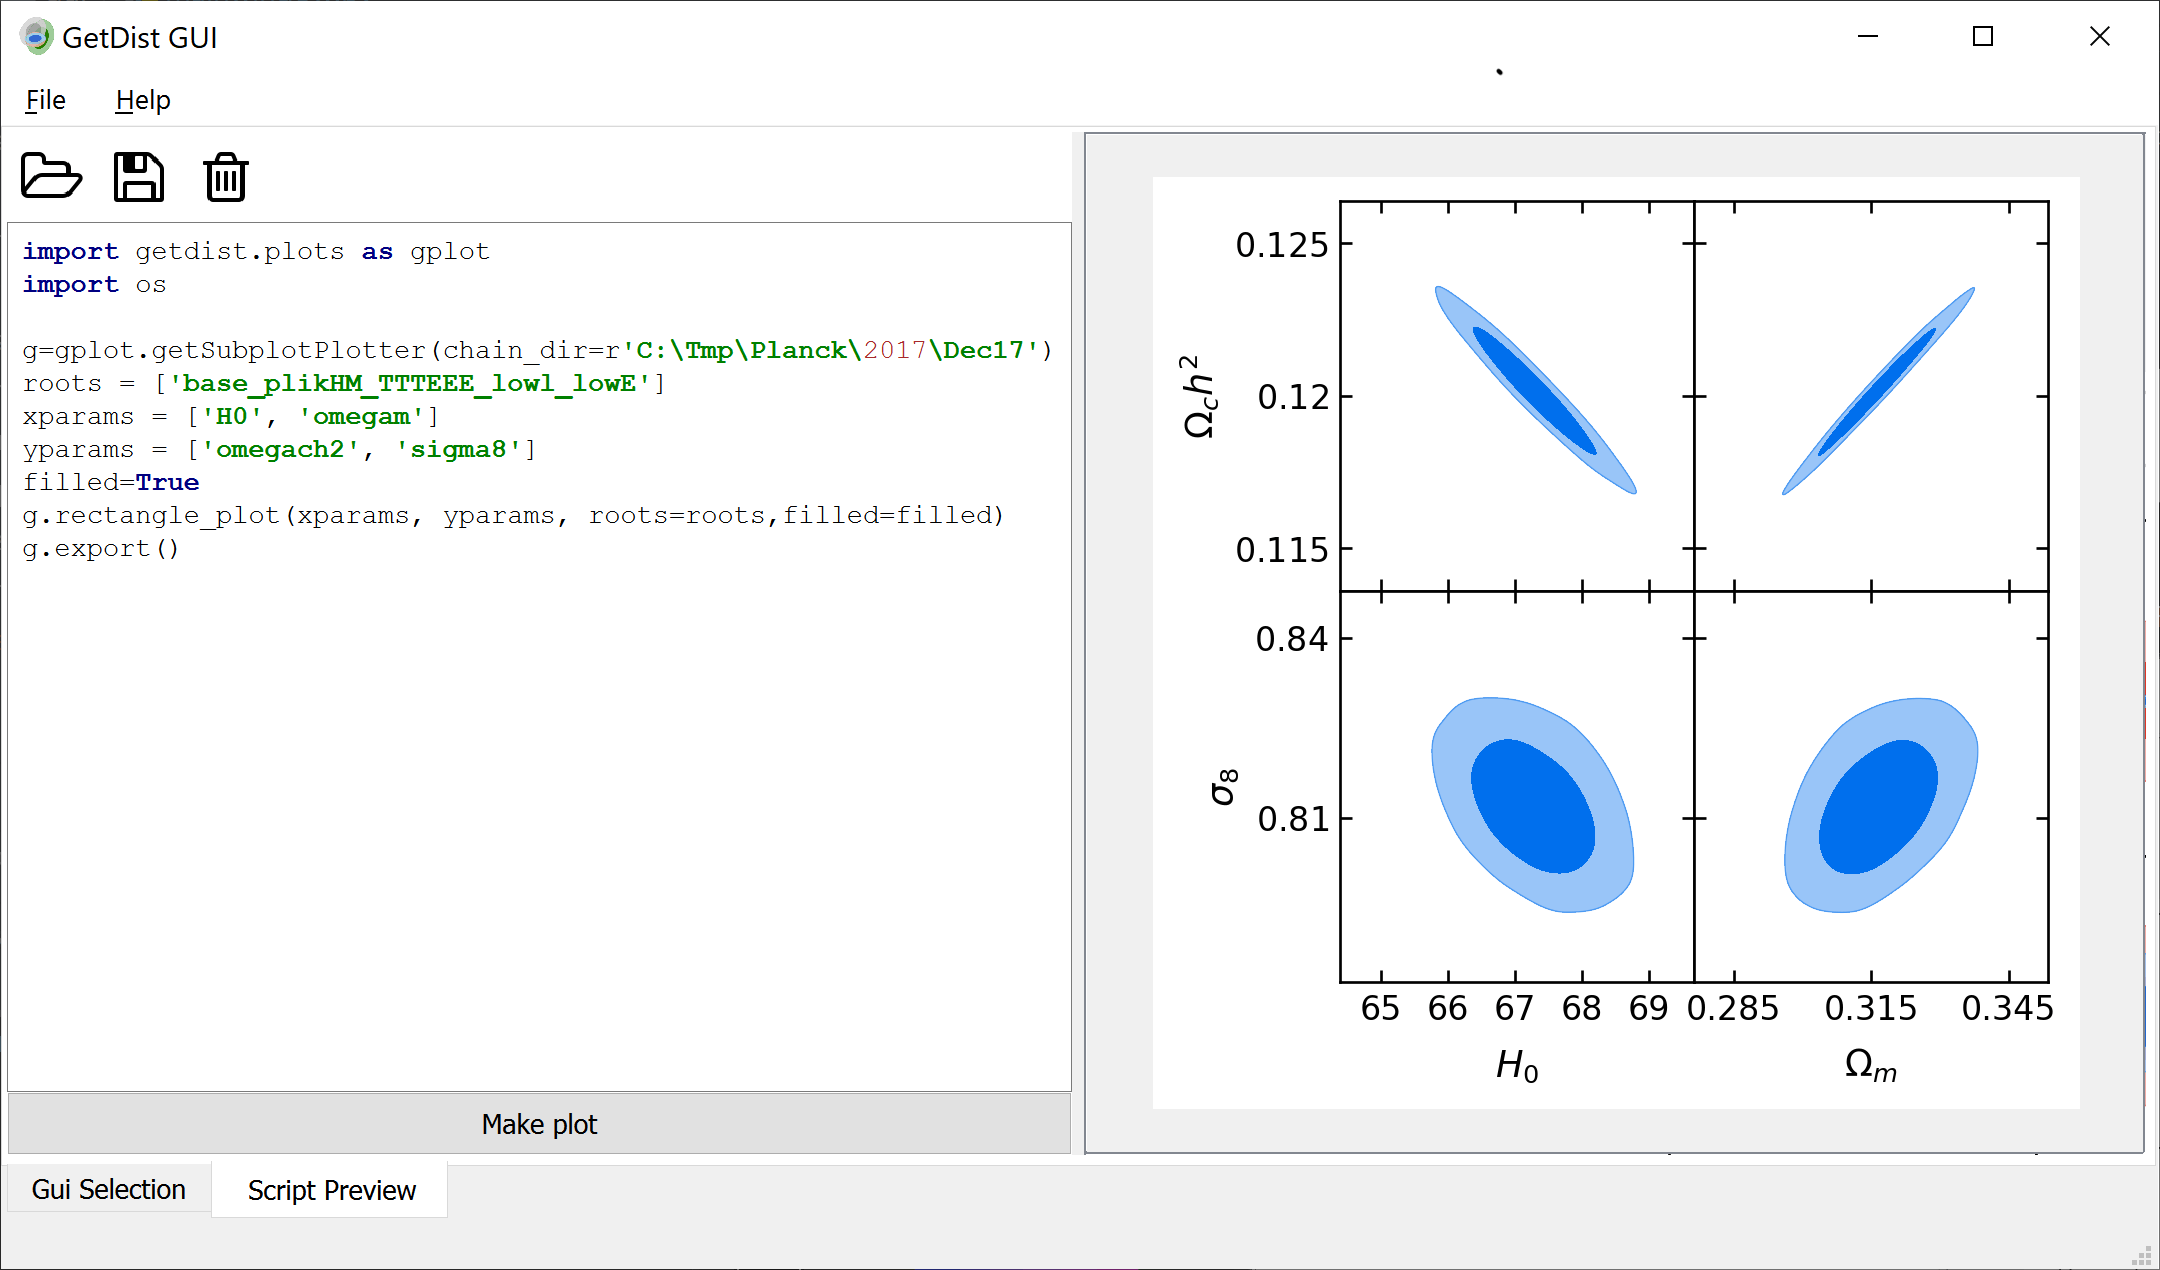
You can also edit and customize the script, or open and play with existing plot scripts.
Statistics and tables
The Data menu has an option to let you view the parameter statistics (.margestats) and latex tables, convergence stats, and view PCA constraints for selected parameters. Note that you need a working latex installation to view rendered parameter tables.
Settings
The Options menu allows you to change a settings defining how limits, lines and contours are calculated, and customize plot options. The “Plot module config” option lets you use a different module to define the plotting functions (the default is getdist.plots).
GUI Script
From python, Run the getdist-gui script to run the traditional graphical user interface. This requires PySide to be installed, but will run on Windows, Linux and Mac.
PySide is not included in default dependencies, but can easily be installed:
pip install PySide6
If you have conflicts, with Anaconda/miniconda you can make a consistent new environment from conda-forge (which includes PySide6), e.g.
conda create -n myenv -c conda-forge scipy matplotlib PyYAML PySide6
Once PySide is set up, (re)install getdist and you should then be able to use the getdist-gui script on your path.
NOTE: currently the mac version may crash run this way, use the pre-built installers linked above if you have issues.
Streamlit-based Web Interface
GetDist also provides a modern web-based interface built with Streamlit. This alternative GUI offers similar functionality to the application but runs in your web browser.
Running Locally
To run the Streamlit app locally, you need to install Streamlit first:
pip install streamlit
Then you can run the app using the getdist-streamlit script. You can also run it directly using
streamlit run getdist/gui/streamlit_app.py
You can also specify a default directory to open:
getdist-streamlit --dir=/path/to/chains
Otherwise the app will automatically look for a default_chains directory in the repository root when it starts.
Online Demo
You can try the Streamlit app online at https://getdist-gui-test.streamlit.app/.
Note that the online demo:
Contains fixed example chains (from https://github.com/cmbant/streamlit-test)
Cannot upload your own chains (as it’s a demonstration of distributing chains with the app)
May not work well with very large chains due to limitations of the free Streamlit hosting
Features
The Streamlit app includes all the core functionality of the Qt-based GUI, but is not quite as well tested:
Opening chain directories and grid structures
Selecting parameters and creating various plot types (1D, 2D, triangle, etc.)
Viewing statistics and parameter tables
Customizing analysis settings and plot options
Exporting plots and scripts