getdist.plots
This module is used for making plots from samples. The get_single_plotter() and get_subplot_plotter() functions are used to make a plotter instance,
which is then used to make and export plots.
Many plotter functions take a roots argument, which is either a root name for
some chain files, or an in-memory MCSamples instance. You can also make comparison plots by giving a list of either of these.
Parameter are referenced simply by name (as specified in the .paramnames file when loading from file, or set in the MCSamples instance).
For functions that takes lists of parameters, these can be just lists of names.
You can also use glob patterns to match specific subsets of parameters (e.g. x* to match all parameters with names starting with x).
Get a |
|
Get a |
|
Main class for making plots from one or more sets of samples. |
|
Settings class (colors, sizes, font, styles etc.) |
- exception getdist.plots.GetDistPlotError[source]
An exception that is raised when there is an error plotting
- class getdist.plots.GetDistPlotSettings(subplot_size_inch: float = 2, fig_width_inch: float | None = None)[source]
Settings class (colors, sizes, font, styles etc.)
- Variables:
alpha_factor_contour_lines – alpha factor for adding contour lines between filled contours
alpha_filled_add – alpha for adding filled contours to a plot
axes_fontsize – Size for axis font at reference axis size
axes_labelsize – Size for axis label font at reference axis size
axis_marker_color – The color for a marker
axis_marker_ls – The line style for a marker
axis_marker_lw – The line width for a marker
axis_tick_powerlimits – exponents at which to use scientific notation for axis tick labels
axis_tick_max_labels – maximum number of tick labels per axis
axis_tick_step_groups – steps to try for axis ticks, in grouped in order of preference
axis_tick_x_rotation – The rotation for the x tick label in degrees
axis_tick_y_rotation – The rotation for the y tick label in degrees
colorbar_axes_fontsize – size for tick labels on colorbar (None for default to match axes font size)
colorbar_label_pad – padding for the colorbar label
colorbar_label_rotation – angle to rotate colorbar label (set to zero if -90 default gives layout problem)
colorbar_tick_rotation – angle to rotate colorbar tick labels
colormap – a Matplotlib color map for shading
colormap_scatter – a Matplotlib color map for 3D scatter plots
constrained_layout – use matplotlib’s constrained-layout to fit plots within the figure and avoid overlaps.
fig_width_inch – The width of the figure in inches
figure_legend_frame – draw box around figure legend
figure_legend_loc – The location for the figure legend
figure_legend_ncol – number of columns for figure legend (set to zero to use defaults)
fontsize – font size for text (and ultimate fallback when others not set)
legend_colored_text – use colored text for legend labels rather than separate color blocks
legend_fontsize – The font size for the legend (defaults to fontsize)
legend_frac_subplot_margin – fraction of subplot size to use for spacing figure legend above plots
legend_frame – draw box around legend
legend_loc – The location for the legend
legend_rect_border – whether to have black border around solid color boxes in legends
line_dash_styles – dict mapping line styles to detailed dash styles, default: {’–’: (3, 2), ‘-.’: (4, 1, 1, 1)}
line_labels – True if you want to automatically add legends when adding more than one line to subplots
line_styles – list of default line styles/colors ([‘-k’, ‘-r’, ‘–C0’, …]) or name of a standard colormap (e.g. tab10), or a list of tuples of line styles and colors for each line
linewidth – relative linewidth (at reference size)
linewidth_contour – linewidth for lines in filled contours
linewidth_meanlikes – linewidth for mean likelihood lines
no_triangle_axis_labels – whether subplots in triangle plots should show axis labels if not at the edge
norm_1d_density – whether to normolize 1D densities (otherwise normalized to unit peak value)
norm_prob_label – label for the y axis in normalized 1D density plots
num_plot_contours – number of contours to plot in 2D plots (up to number of contours in analysis settings)
num_shades – number of distinct colors to use for shading shaded 2D plots
param_names_for_labels – file name of .paramnames file to use for overriding parameter labels for plotting
plot_args – dict, or list of dicts, giving settings like color, ls, alpha, etc. to apply for a plot or each line added
plot_meanlikes – include mean likelihood lines in 1D plots
prob_label – label for the y axis in unnormalized 1D density plots
prob_y_ticks – show ticks on y axis for 1D density plots
progress – write out some status
scaling – True to scale down fonts and lines for smaller subplots; False to use fixed sizes.
scaling_max_axis_size – font sizes will only be scaled for subplot widths (in inches) smaller than this.
scaling_factor – factor by which to multiply the difference of the axis size to the reference size when scaling font sizes
scaling_reference_size – axis width (in inches) at which font sizes are specified.
direct_scaling – True to directly scale the font size with the axis size for small axes (can be very small)
scatter_size – size of points in “3D” scatter plots
shade_level_scale – shading contour colors are put at [0:1:spacing]**shade_level_scale
shade_meanlikes – 2D shading uses mean likelihoods rather than marginalized density
solid_colors – List of default colors for filled 2D plots or the name of a colormap (e.g. tab10). If a list, each element is either a color, or a tuple of values for different contour levels.
solid_contour_palefactor – factor by which to make 2D outer filled contours paler when only specifying one contour color
subplot_size_ratio – ratio of width and height of subplots
tight_layout – use tight_layout to layout, avoid overlaps and remove white space; if it doesn’t work try constrained_layout. If true it is applied when calling
finish_plot()(which is called automatically by plots_xd(), triangle_plot and rectangle_plot).title_limit – show parameter limits over 1D plots, 1 for first limit (68% default), 2 second, etc.
title_limit_labels – whether or not to include parameter label when adding limits above 1D plots
title_limit_fontsize – font size to use for limits in plot titles (defaults to axes_labelsize)
If fig_width_inch set, fixed setting for fixed total figure size in inches. Otherwise, use subplot_size_inch to determine default font sizes etc., and figure will then be as wide as necessary to show all subplots at specified size.
- Parameters:
subplot_size_inch – Determines the size of subplots, and hence default font sizes
fig_width_inch – The width of the figure in inches, If set, forces fixed total size.
- rc_sizes(axes_fontsize=None, lab_fontsize=None, legend_fontsize=None)[source]
Sets the font sizes by default from matplotlib.rcParams defaults
- Parameters:
axes_fontsize – The font size for the plot axes tick labels (default: xtick.labelsize).
lab_fontsize – The font size for the plot’s axis labels (default: axes.labelsize)
legend_fontsize – The font size for the plot’s legend (default: legend.fontsize)
- set_with_subplot_size(size_inch=3.5, size_mm=None, size_ratio=None)[source]
Sets the subplot’s size, either in inches or in millimeters. If both are set, uses millimeters.
- Parameters:
size_inch – The size to set in inches; is ignored if size_mm is set.
size_mm – None if not used, otherwise the size in millimeters we want to set for the subplot.
size_ratio – ratio of height to width of subplots
- class getdist.plots.GetDistPlotter(chain_dir: str | Iterable[str] | None = None, settings: GetDistPlotSettings | None = None, analysis_settings: str | dict | IniFile = None, auto_close=False)[source]
Main class for making plots from one or more sets of samples.
- Variables:
settings – a
GetDistPlotSettingsinstance with settingssubplots – a 2D array of
Axesfor subplotssample_analyser – a
MCSampleAnalysisinstance for gettingMCSamplesand derived data from a given root name tag (e.g. sample_analyser.samples_for_root(‘rootname’))
- Parameters:
chain_dir – Set this to a directory or grid directory hierarchy to search for chains (can also be a list of such, searched in order)
analysis_settings – The settings to be used by
MCSampleAnalysiswhen analysing samplesauto_close – whether to automatically close the figure whenever a new plot made or this instance released
- add_1d(root, param, plotno=0, normalized=None, ax=None, title_limit=None, **kwargs)[source]
Low-level function to add a 1D marginalized density line to a plot
- Parameters:
root – The root name of the samples
param – The parameter name
plotno – The index of the line being added to the plot
normalized – True if areas under the curves should match, False if normalized to unit maximum. Default from settings.norm_1d_density.
ax – optional
Axesinstance (or y,x subplot coordinate) to add to (defaults to current plot or the first/main plot if none)title_limit – if not None, a maginalized limit (1,2..) to print as the title of the plot
kwargs – arguments for
plot()
- Returns:
min, max for the plotted density
- add_2d_contours(root, param1=None, param2=None, plotno=0, of=None, cols=None, contour_levels=None, add_legend_proxy=True, param_pair=None, density=None, alpha=None, ax=None, mask_function: callable = None, **kwargs)[source]
Low-level function to add 2D contours to plot for samples with given root name and parameters
- Parameters:
root – The root name of samples to use or a
MixtureNDgaussian mixtureparam1 – x parameter
param2 – y parameter
plotno – The index of the contour lines being added
of – the total number of contours being added (this is line plotno of
of)cols – optional list of colors to use for contours, by default uses default for this plotno
contour_levels – levels at which to plot the contours, by default given by contours array in the analysis settings
add_legend_proxy – True to add a proxy to the legend of this plot.
param_pair – an [x,y] parameter name pair if you prefer to provide this rather than param1 and param2
density – optional
Density2Dto plot rather than that computed automatically from the samplesalpha – alpha for the contours added
ax – optional
Axesinstance (or y,x subplot coordinate) to add to (defaults to current plot or the first/main plot if none)mask_function – optional function, mask_function(minx, miny, stepx, stepy, mask), which which sets mask to zero for values of parameter name that are excluded by prior. This is used to correctly estimate densities near the boundary. See the example in the plot gallery.
kwargs –
optional keyword arguments:
filled: True to make filled contours
color: top color to automatically make paling contour colours for a filled plot
kwargs for
contour()andcontourf()
- Returns:
bounds (from
bounds()) for the 2D density plotted
- add_2d_covariance(means, cov, xvals=None, yvals=None, def_width=4.0, samples_per_std=50.0, **kwargs)[source]
Plot 2D Gaussian ellipse. By default, plots contours for 1 and 2 sigma. Specify contour_levels argument to plot other contours (for density normalized to peak at unity).
- Parameters:
means – array of y
cov – the 2x2 covariance
xvals – optional array of x values to evaluate at
yvals – optional array of y values to evaluate at
def_width – if evaluation array not specified, width to use in units of standard deviation
samples_per_std – if evaluation array not specified, number of grid points per standard deviation
kwargs – keyword arguments for
add_2D_contours()
- add_2d_density_contours(density, **kwargs)[source]
Low-level function to add 2D contours to a plot using provided density
- Parameters:
density – a
densities.Density2Dinstancekwargs – arguments for
add_2d_contours()
- Returns:
bounds (from
bounds()) of density
- add_2d_scatter(root, x, y, color='k', alpha=1, extra_thin=1, scatter_size=None, ax=None)[source]
Low-level function to add a 2D sample scatter plot to the current axes (or ax if specified).
- Parameters:
root – The root name of the samples to use
x – name of x parameter
y – name of y parameter
color – color to plot the samples
alpha – The alpha to use.
extra_thin – thin the weight one samples by this additional factor before plotting
scatter_size – point size (default: settings.scatter_size)
ax – optional
Axesinstance (or y,x subplot coordinate) to add to (defaults to current plot or the first/main plot if none)
- Returns:
(xmin, xmax), (ymin, ymax) bounds for the axes.
- add_2d_shading(root, param1, param2, colormap=None, density=None, ax=None, **kwargs)[source]
Low-level function to add 2D density shading to the given plot.
- Parameters:
root – The root name of samples to use
param1 – x parameter
param2 – y parameter
colormap – color map, default to settings.colormap (see
GetDistPlotSettings)density – optional user-provided
Density2Dto plot rather than the auto-generated density from the samplesax – optional
Axesinstance (or y,x subplot coordinate) to add to (defaults to current plot or the first/main plot if none)kwargs – keyword arguments for
contourf()
- add_3d_scatter(root, params, color_bar=True, alpha=1, extra_thin=1, scatter_size=None, ax=None, alpha_samples=False, **kwargs)[source]
Low-level function to add a 3D scatter plot to the current axes (or ax if specified). Here 3D means a 2D plot, with samples colored by a third parameter.
- Parameters:
root – The root name of the samples to use
params – list of parameters to plot
color_bar – True to add a colorbar for the plotted scatter color
alpha – The alpha to use.
extra_thin – thin the weight one samples by this additional factor before plotting
scatter_size – point size (default: settings.scatter_size)
alpha_samples – use all samples, giving each point alpha corresponding to relative weight
ax – optional
Axesinstance (or y,x subplot coordinate) to add to (defaults to current plot or the first/main plot if none)kwargs – arguments for
add_colorbar()
- Returns:
(xmin, xmax), (ymin, ymax) bounds for the axes.
- add_bands(x, y, errors, color='gray', nbands=2, alphas=(0.25, 0.15, 0.1), lw=0.2, lw_center=None, linecolor='k', ax=None)[source]
Add a constraint band as a function of x showing e.g. a 1 and 2 sigma range.
- Parameters:
x – array of x values
y – array of central values for the band as function of x
errors – array of errors as a function of x
color – a fill color
nbands – number of bands to plot. If errors are 1 sigma, using nbands=2 will plot 1 and 2 sigma.
alphas – tuple of alpha factors to use for each error band
lw – linewidth for the edges of the bands
lw_center – linewidth for the central mean line (zero or None not to have one, the default)
linecolor – a line color for central line
ax – optional
Axesinstance (or y,x subplot coordinate) to add to (defaults to current plot or the first/main plot if none)
- add_colorbar(param, orientation='vertical', mappable=None, ax=None, colorbar_args: Mapping = mappingproxy({}), **ax_args)[source]
Adds a color bar to the given plot.
- Parameters:
param – a
ParamInfowith label for the parameter the color bar is describingorientation – The orientation of the color bar (default: ‘vertical’)
mappable – the thing to color, defaults to current scatter
ax – optional
Axesinstance to add to (defaults to current plot)colorbar_args – optional arguments for
colorbar()ax_args –
extra arguments -
color_label_in_axes - if True, label is not added (insert as text label in plot instead)
- Returns:
The new
Colorbarinstance
- add_legend(legend_labels, legend_loc=None, line_offset=0, legend_ncol=None, colored_text=None, figure=False, ax=None, label_order=None, align_right=False, fontsize=None, figure_legend_outside=True, **kwargs)[source]
Add a legend to the axes or figure.
- Parameters:
legend_labels – The labels
legend_loc – The legend location, default from settings
line_offset – The offset of plotted lines to label (e.g. 1 to not label first line)
legend_ncol – The number of columns in the legend, defaults to 1
colored_text –
True: legend labels are colored to match the lines/contours
False: colored lines/boxes are drawn before black labels
figure – True if legend is for the figure rather than the selected axes
ax – if figure == False, the
Axesinstance to use; defaults to current axes.label_order – minus one to show legends in reverse order that lines were added, or a list giving specific order of line indices
align_right – True to align legend text at the right
fontsize – The size of the font, default from settings
figure_legend_outside – whether figure legend is outside or inside the subplots box
kwargs – optional extra arguments for legend function
- Returns:
a
matplotlib.legend.Legendinstance
- add_line(xdata, ydata, zorder=0, color=None, ls=None, ax=None, **kwargs)[source]
Adds a line to the given axes, using
Line2D- Parameters:
xdata – a pair of x coordinates
ydata – a pair of y coordinates
zorder – Z-order for Line2D
color – The color of the line, uses settings.axis_marker_color by default
ls – The line style to be used, uses settings.axis_marker_ls by default
ax – optional
Axesinstance (or y,x subplot coordinate) to add to (defaults to current plot or the first/main plot if none)kwargs – Additional arguments for
Line2D
- add_param_markers(param_value_dict: dict[str, Iterable[float] | float], *, color=None, ls=None, lw=None)[source]
Adds vertical and horizontal lines on all subplots marking some parameter values.
- Parameters:
param_value_dict – dictionary of parameter names and values to mark (number or list)
color – optional color of the marker
ls – optional line style of the marker
lw – optional line width.
- add_text_left(text_label, x=0.05, y=0.06, ax=None, **kwargs)[source]
Add text to the left, Wraps add_text.
- add_x_bands(x, sigma, color='gray', ax=None, alpha1=0.15, alpha2=0.1, **kwargs)[source]
Adds vertical shaded bands showing one and two sigma ranges.
- Parameters:
x – central x value for bands
sigma – 1 sigma error on x
color – The base color to use
ax – optional
Axesinstance (or y,x subplot coordinate) to add to (defaults to current plot or the first/main plot if none)alpha1 – alpha for the 1 sigma band; note this is drawn on top of the 2 sigma band. Set to zero if you only want 2 sigma band
alpha2 – alpha for the 2 sigma band. Set to zero if you only want 1 sigma band
kwargs – optional keyword arguments for
axvspan()
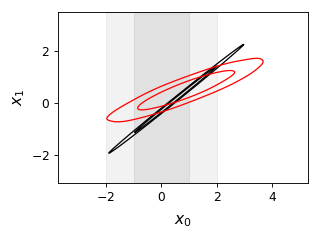
from getdist import plots, gaussian_mixtures
samples1, samples2 = gaussian_mixtures.randomTestMCSamples(ndim=2, nMCSamples=2)
g = plots.get_single_plotter(width_inch=4)
g.plot_2d([samples1, samples2], ['x0','x1'], filled=False);
g.add_x_bands(0, 1)
- add_x_marker(marker: float | Sequence[float], color=None, ls=None, lw=None, ax=None, **kwargs)[source]
Adds vertical lines marking x values. Optional arguments can override default settings.
- Parameters:
marker – The x coordinate of the location of the marker line, or a list for multiple lines
color – optional color of the marker
ls – optional line style of the marker
lw – optional line width
ax – optional
Axesinstance (or y,x subplot coordinate) to add to (defaults to current plot or the first/main plot if none)kwargs – additional arguments to pass to
axvline()
- add_y_bands(y, sigma, color='gray', ax=None, alpha1=0.15, alpha2=0.1, **kwargs)[source]
Adds horizontal shaded bands showing one and two sigma ranges.
- Parameters:
y – central y value for bands
sigma – 1 sigma error on y
color – The base color to use
ax – optional
Axesinstance (or y,x subplot coordinate) to add to (defaults to current plot or the first/main plot if none)alpha1 – alpha for the 1 sigma band; note this is drawn on top of the 2 sigma band. Set to zero if you only want 2 sigma band
alpha2 – alpha for the 2 sigma band. Set to zero if you only want 1 sigma band
kwargs – optional keyword arguments for
axhspan()
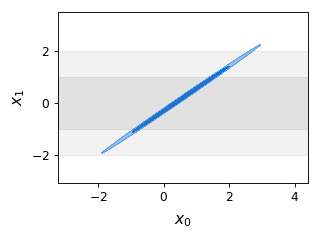
from getdist import plots, gaussian_mixtures
samples = gaussian_mixtures.randomTestMCSamples(ndim=2, nMCSamples=1)
g = plots.get_single_plotter(width_inch=4)
g.plot_2d(samples, ['x0','x1'], filled=True);
g.add_y_bands(0, 1)
- add_y_marker(marker: float | Iterable[float], color=None, ls=None, lw=None, ax=None, **kwargs)[source]
Adds horizontal lines marking y values. Optional arguments can override default settings.
- Parameters:
marker – The y coordinate of the location of the marker line, or a list for multiple lines
color – optional color of the marker
ls – optional line style of the marker
lw – optional line width.
ax – optional
Axesinstance (or y,x subplot coordinate) to add to (defaults to current plot or the first/main plot if none)kwargs – additional arguments to pass to
axhline()
- default_col_row(nplot=1, nx=None, ny=None)[source]
Get default subplot columns and rows depending on number of subplots.
- Parameters:
nplot – total number of subplots
nx – optional specified number of columns
ny – optional specified number of rows
- Returns:
n_cols, n_rows
- export(fname=None, adir=None, watermark=None, tag=None, **kwargs)[source]
Exports given figure to a file. If the filename is not specified, saves to a file with the same name as the calling script (useful for plot scripts where the script name matches the output figure).
- Parameters:
fname – The filename to export to. The extension (.pdf, .png, etc.) determines the file type
adir – The directory to save to
watermark – a watermark text, e.g. to make the plot with some pre-final version number
tag – A suffix to add to the filename.
- finish_plot(legend_labels=None, legend_loc=None, line_offset=0, legend_ncol=None, label_order=None, no_extra_legend_space=False, no_tight=False, **legend_args)[source]
Finish the current plot, adjusting subplot spacing and adding legend if required.
- Parameters:
legend_labels – The labels for a figure legend
legend_loc – The legend location, default from settings (figure_legend_loc)
line_offset – The offset of plotted lines to label (e.g. 1 to not label first line)
legend_ncol – The number of columns in the legend, defaults to 1
label_order – minus one to show legends in reverse order that lines were added, or a list giving specific order of line indices
no_extra_legend_space – True to put figure legend inside the figure box
no_tight – don’t use
tight_layout()to adjust subplot positionslegend_args – optional parameters for the legend
- get_axes(ax=None, pars=None)[source]
Get the axes instance corresponding to the given subplot (y,x) coordinates, parameter list, or otherwise if ax is None get the last subplot axes used, or generate the first (possibly only) subplot if none.
- get_axes_for_params(*pars, **kwargs)[source]
Get axes corresponding to given parameters
- Parameters:
pars – x or x,y or x,y,color parameters
kwargs – set ordered=False to match y,x as well as x,y
- Returns:
axes instance or None if not found
- get_param_array(roots, params: None | str | Sequence = None, renames: Mapping = None)[source]
Gets an array of
ParamInfofor named params in the given root.If a parameter is not found in root, returns the original ParamInfo if ParamInfo was passed, or fails otherwise.
- Parameters:
roots – The root name of the samples to use, or list of roots
params – the parameter names (if not specified, get all in first root)
renames – optional dictionary mapping input names and equivalent names used by the samples
- Returns:
list of
ParamInfoinstances for the parameters
- make_figure(nplot=1, nx=None, ny=None, xstretch=1.0, ystretch=1.0, sharex=False, sharey=False)[source]
Makes a new figure with one or more subplots.
- Parameters:
nplot – number of subplots
nx – number of subplots in each row
ny – number of subplots in each column
xstretch – The parameter of how much to stretch the width, 1 is default
ystretch – The parameter of how much to stretch the height, 1 is default. Note this multiplies settings.subplot_size_ratio before determining actual stretch.
sharex – no vertical space between subplots
sharey – no horizontal space between subplots
- Returns:
The plot_col, plot_row numbers of subplots for the figure
- new_plot(close_existing=None)[source]
Resets the given plotter to make a new empty plot.
- Parameters:
close_existing – True to close any current figure
- param_bounds_for_root(root)[source]
Get any hard prior bounds for the parameters with root file name
- Parameters:
root – The root name to be used
- Returns:
object with get_upper() or getUpper() and get_lower() or getLower() bounds functions
- param_latex_label(root, name, label_params=None)[source]
Returns the latex label for given parameter.
- Parameters:
root – root name of the samples having the parameter (or
MCSamplesinstance)name – The param name
label_params – optional name of .paramnames file to override parameter name labels
- Returns:
The latex label
- param_names_for_root(root)[source]
Get the parameter names and labels
ParamNamesinstance for the given root name- Parameters:
root – The root name of the samples.
- Returns:
ParamNamesinstance
- plot_1d(roots, param, marker=None, marker_color=None, label_right=False, title_limit=None, no_ylabel=False, no_ytick=False, no_zero=False, normalized=False, param_renames=None, ax=None, **kwargs)[source]
Make a single 1D plot with marginalized density lines.
- Parameters:
roots – root name or
MCSamplesinstance (or list of any of either of these) for the samples to plotparam – the parameter name to plot
marker – If set, places a marker at given coordinate (or list of coordinates).
marker_color – If set, sets the marker color.
label_right – If True, label the y-axis on the right rather than the left
title_limit – If not None, a maginalized limit (1,2..) of the first root to print as the title of the plot
no_ylabel – If True excludes the label on the y-axis
no_ytick – If True show no y ticks
no_zero – If true does not show tick label at zero on y-axis
normalized – plot normalized densities (if False, densities normalized to peak at 1)
param_renames – optional dictionary mapping input parameter names to equivalent names used by the samples
ax – optional
Axesinstance (or y,x subplot coordinate) to add to (defaults to current plot or the first/main plot if none)kwargs –
additional optional keyword arguments:
lims: optional limits for x range of the plot [xmin, xmax]
ls : list of line styles for the different lines plotted
colors: list of colors for the different lines plotted
lws: list of line widths for the different lines plotted
alphas: list of alphas for the different lines plotted
line_args: a list of dictionaries with settings for each set of lines
marker_args: a dictionary with settings for the marker(s)
arguments for
set_axes()
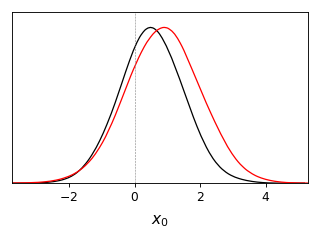
from getdist import plots, gaussian_mixtures
samples1, samples2 = gaussian_mixtures.randomTestMCSamples(ndim=2, nMCSamples=2)
g = plots.get_single_plotter(width_inch=4)
g.plot_1d([samples1, samples2], 'x0', marker=0)
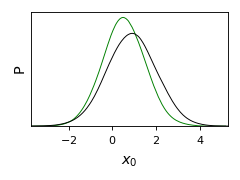
from getdist import plots, gaussian_mixtures
samples1, samples2 = gaussian_mixtures.randomTestMCSamples(ndim=2, nMCSamples=2)
g = plots.get_single_plotter(width_inch=3)
g.plot_1d([samples1, samples2], 'x0', normalized=True, colors=['green','black'])
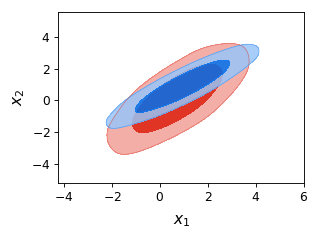
- plot_2d(roots, param1=None, param2=None, param_pair=None, shaded=False, add_legend_proxy=True, line_offset=0, proxy_root_exclude=(), ax=None, mask_function: callable = None, **kwargs)[source]
Create a single 2D line, contour or filled plot.
- Parameters:
roots – root name or
MCSamplesinstance (or list of any of either of these) for the samples to plotparam1 – x parameter name
param2 – y parameter name
param_pair – An [x,y] pair of params; can be set instead of param1 and param2
shaded – True or integer if plot should be a shaded density plot, where the integer specifies the index of which contour is shaded (first samples shaded if True provided instead of an integer)
add_legend_proxy – True to add to the legend proxy
line_offset – line_offset if not adding first contours to plot
proxy_root_exclude – any root names not to include when adding to the legend proxy
ax – optional
Axesinstance (or y,x subplot coordinate) to add to (defaults to current plot or the first/main plot if none)mask_function –
Function that defines regions in the 2D parameter space that are excluded by a prior, which is needed to correctly estimate kernel densities near the sharp boundary defined by the mask function.
Must have signature mask_function(minx, miny, stepx, stepy, mask), where:
minx, miny: minimum values of x and y parameters
stepx, stepy: step sizes in x and y directions
mask: 2D boolean numpy array (modified in-place)
The function should set mask values to 0 where points should be excluded by the prior. Useful for implementing non-rectangular prior boundaries not aligned with parameter axes, - see the example in the plot gallery. Note it should not include simple axis-aligned range priors that are accounted for automatically.
kwargs –
additional optional arguments:
filled: True for filled contours
lims: list of limits for the plot [xmin, xmax, ymin, ymax]
ls : list of line styles for the different sample contours plotted
colors: list of colors for the different sample contours plotted
lws: list of line widths for the different sample contours plotted
alphas: list of alphas for the different sample contours plotted
line_args: a list of dictionaries with settings for each set of contours
arguments for
set_axes()
- Returns:
The xbounds, ybounds of the plot.
from getdist import plots, gaussian_mixtures
samples1, samples2 = gaussian_mixtures.randomTestMCSamples(ndim=4, nMCSamples=2)
g = plots.get_single_plotter(width_inch = 4)
g.plot_2d([samples1,samples2], 'x1', 'x2', filled=True);
- plot_2d_scatter(roots, param1, param2, color='k', line_offset=0, add_legend_proxy=True, **kwargs)[source]
Make a 2D sample scatter plot.
If roots is a list of more than one, additional densities are plotted as contour lines.
- Parameters:
roots – root name or
MCSamplesinstance (or list of any of either of these) for the samples to plotparam1 – name of x parameter
param2 – name of y parameter
color – color to plot the samples
line_offset – The line index offset for added contours
add_legend_proxy – True to add a legend proxy
kwargs –
additional optional arguments:
filled: True for filled contours for second and later items in roots
lims: limits for the plot [xmin, xmax, ymin, ymax]
ls : list of line styles for the different sample contours plotted
colors: list of colors for the different sample contours plotted
lws: list of linewidths for the different sample contours plotted
alphas: list of alphas for the different sample contours plotted
line_args: a list of dict with settings for contours from each root
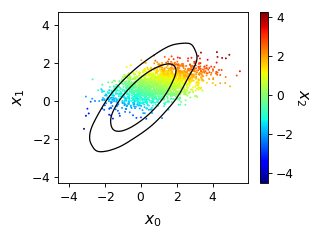
- plot_3d(roots, params=None, params_for_plots=None, color_bar=True, line_offset=0, add_legend_proxy=True, alpha_samples=False, ax=None, **kwargs)[source]
Make a 2D scatter plot colored by the value of a third parameter (a 3D plot).
If roots is a list of more than one, additional densities are plotted as contour lines.
- Parameters:
roots – root name or
MCSamplesinstance (or list of any of either of these) for the samples to plotparams – list with the three parameter names to plot (x, y, color)
params_for_plots – list of parameter triplets to plot for each root plotted; more general alternative to params
color_bar – True to include a color bar
line_offset – The line index offset for added contours
add_legend_proxy – True to add a legend proxy
alpha_samples – if True, use alternative scatter style where all samples are plotted alphaed by their weights
ax – optional
Axesinstance (or y,x subplot coordinate) to add to (defaults to current plot or the first/main plot if none)kwargs –
additional optional arguments:
filled: True for filled contours for second and later items in roots
lims: limits for the plot [xmin, xmax, ymin, ymax]
ls : list of line styles for the different sample contours plotted
colors: list of colors for the different sample contours plotted
lws: list of linewidths for the different sample contours plotted
alphas: list of alphas for the different sample contours plotted
line_args: a list of dict with settings for contours from each root
arguments for
add_colorbar()
from getdist import plots, gaussian_mixtures
samples1, samples2 = gaussian_mixtures.randomTestMCSamples(ndim=3, nMCSamples=2)
g = plots.get_single_plotter(width_inch=4)
g.plot_3d([samples1, samples2], ['x0','x1','x2']);
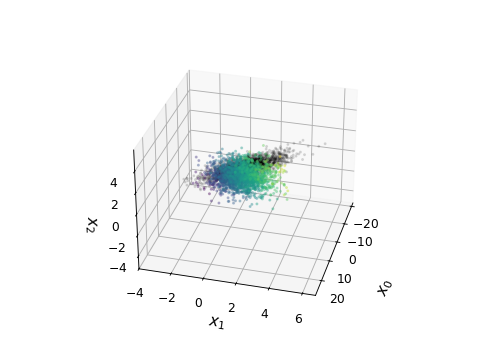
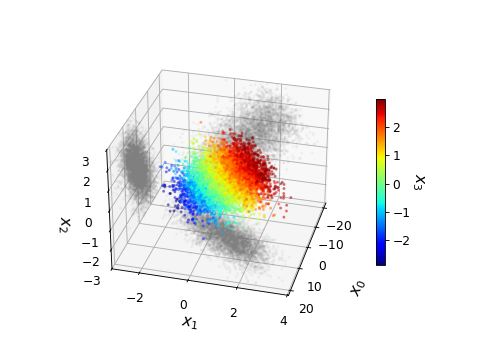
- plot_4d(roots, params, color_bar=True, colorbar_args: Mapping = mappingproxy({}), ax=None, lims=mappingproxy({}), azim: float | None = 15, elev: float | None = None, dist: float = 12, alpha: float | Sequence[float] = 0.5, marker='o', max_scatter_points: int | None = None, shadow_color=None, shadow_alpha=0.1, fixed_color=None, compare_colors=None, animate=False, anim_angle_degrees=360, anim_step_degrees=0.6, anim_fps=15, mp4_filename: str | None = None, mp4_bitrate=-1, **kwargs)[source]
Make a 3d x-y-z scatter plot colored by the value of a fourth parameter. If animate is True, it will rotate, and can be saved to an mp4 video file by setting mp4_filename (you must have ffmpeg installed). Note animations can be quite slow to render.
- Parameters:
roots – root name or
MCSamplesinstance (or list of any of either of these) for the samples to plotparams – list with the three parameter names to plot and color (x, y, x, color); can also set fixed_color and specify just three parameters
color_bar – True if you want to include a color bar
colorbar_args – extra arguments for colorbar
ax – optional
Axes3Dinstance to add to (defaults to current plot or the first/main plot if none)lims – dictionary of optional limits, e.g. {‘param1’:(min1, max1),’param2’:(min2,max2)}. If this includes parameters that are not plotted, the samples outside the limits will still be removed
azim – azimuth for initial view
elev – elevation for initial view
dist – distance for view (make larger if labels out of area)
alpha – alpha, or list of alphas for each root, to use for scatter samples
marker – marker, or list of markers for each root
max_scatter_points – if set, maximum number of points to plots from each root
shadow_color – if not None, a color value (or list of color values) to use for plotting axes-projected samples; or True to plot gray shadows
shadow_alpha – if not None, separate alpha or list of alpha for shadows
fixed_color – if not None, a fixed color for the first-root scatter plot rather than a 4th parameter value
compare_colors – if not None, fixed scatter color for second-and-higher roots rather than using 4th parameter value
animate – if True, rotate the plot
anim_angle_degrees – total angle for animation rotation
anim_step_degrees – angle per frame
anim_fps – animation frames per second
mp4_filename – if animating, optional filename to produce mp4 video
mp4_bitrate – bitrate
kwargs – additional optional arguments for
scatter()
from getdist import plots, gaussian_mixtures

samples1, samples2 = gaussian_mixtures.randomTestMCSamples(ndim=4, nMCSamples=2)
samples1.samples[:, 0] *= 5  # stretch out in one direction
g = plots.get_single_plotter()
g.plot_4d([samples1, samples2], ['x0', 'x1', 'x2', 'x3'],
          cmap='viridis', color_bar=False,
          alpha=[0.3, 0.1],  shadow_color=False, compare_colors=['k'])
from getdist import plots, gaussian_mixtures

samples1 = gaussian_mixtures.randomTestMCSamples(ndim=4)
samples1.samples[:, 0] *= 5  # stretch out in one direction
g = plots.get_single_plotter()
g.plot_4d(samples1, ['x0', 'x1', 'x2', 'x3'], cmap='jet',
          alpha=0.4, shadow_alpha=0.05, shadow_color=True,
          max_scatter_points=6000,
          lims={'x2': (-3, 3), 'x3': (-3, 3)},
          colorbar_args={'shrink': 0.6})
Generate an mp4 video (in jupyter, using a notebook rather than inline matplotlib):
g.plot_4d([samples1, samples2], ['x0', 'x1', 'x2', 'x3'], cmap='viridis',
  alpha = [0.3,0.1], shadow_alpha=[0.1,0.005], shadow_color=False,
  compare_colors=['k'],
  animate=True, mp4_filename='sample_rotation.mp4', mp4_bitrate=1024, anim_fps=20)
See sample output video.
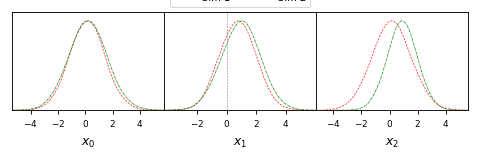
- plots_1d(roots, params=None, legend_labels=None, legend_ncol=None, label_order=None, nx=None, param_list=None, roots_per_param=False, share_y=None, markers=None, title_limit=None, xlims=None, param_renames=None, **kwargs)[source]
Make an array of 1D marginalized density subplots
- Parameters:
roots – root name or
MCSamplesinstance (or list of any of either of these) for the samples to plotparams – list of names of parameters to plot
legend_labels – list of legend labels
legend_ncol – Number of columns for the legend.
label_order – minus one to show legends in reverse order that lines were added, or a list giving specific order of line indices
nx – number of subplots per row
param_list – name of .paramnames file listing specific subset of parameters to plot
roots_per_param – True to use a different set of samples for each parameter: plots param[i] using roots[i] (where roots[i] is the list of sample root names to use for plotting parameter i). This is useful for example for plotting one-parameter extensions of a baseline model, each with various data combinations.
share_y – True for subplots to share a common y-axis with no horizontal space between subplots
markers – optional dict giving vertical marker values indexed by parameter, or a list of marker values for each parameter plotted
title_limit – if not None, a maginalized limit (1,2..) of the first root to print as the title of each of the plots
xlims – list of [min,max] limits for the range of each parameter plot
param_renames – optional dictionary holding mapping between input names and equivalent names used in the samples.
kwargs – optional keyword arguments for
plot_1d()
- Returns:
The plot_col, plot_row subplot dimensions of the new figure
from getdist import plots, gaussian_mixtures
samples1, samples2 = gaussian_mixtures.randomTestMCSamples(ndim=4, nMCSamples=2)
g = plots.get_subplot_plotter()
g.plots_1d([samples1, samples2], ['x0', 'x1', 'x2'], nx=3, share_y=True, legend_ncol =2,
             markers={'x1':0}, colors=['red', 'green'], ls=['--', '-.'])
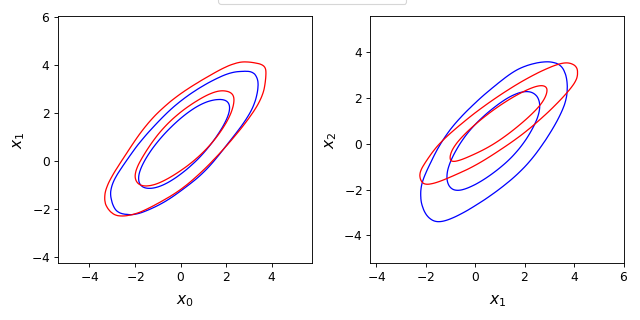
- plots_2d(roots, param1=None, params2=None, param_pairs=None, nx=None, legend_labels=None, legend_ncol=None, label_order=None, filled=False, shaded=False, **kwargs)[source]
Make an array of 2D line, filled or contour plots.
- Parameters:
roots – root name or
MCSamplesinstance (or list of either of these) for the samples to plotparam1 – x parameter to plot
params2 – list of y parameters to plot against x
param_pairs – list of [x,y] parameter pairs to plot; either specify param1, param2, or param_pairs
nx – number of subplots per row
legend_labels – The labels used for the legend.
legend_ncol – The amount of columns in the legend.
label_order – minus one to show legends in reverse order that lines were added, or a list giving specific order of line indices
filled – True to plot filled contours
shaded – True to shade by the density for the first root plotted (unless specified otherwise)
kwargs – optional keyword arguments for
plot_2d()
- Returns:
The plot_col, plot_row subplot dimensions of the new figure
from getdist import plots, gaussian_mixtures
samples1, samples2 = gaussian_mixtures.randomTestMCSamples(ndim=4, nMCSamples=2)
g = plots.get_subplot_plotter(subplot_size=4)
g.settings.legend_frac_subplot_margin = 0.05
g.plots_2d([samples1, samples2], param_pairs=[['x0', 'x1'], ['x1', 'x2']],
                        nx=2, legend_ncol=2, colors=['blue', 'red'])
- plots_2d_triplets(root_params_triplets, nx=None, filled=False, x_lim=None)[source]
Creates an array of 2D plots, where each plot uses different samples, x and y parameters
- Parameters:
root_params_triplets – a list of (root, x, y) giving sample root names, and x and y parameter names to plot in each subplot
nx – number of subplots per row
filled – True for filled contours
x_lim – limits for all the x axes.
- Returns:
The plot_col, plot_row subplot dimensions of the new figure
- plots_3d(roots, param_sets, nx=None, legend_labels=None, **kwargs)[source]
Create multiple 3D subplots
- Parameters:
roots – root name or
MCSamplesinstance (or list of any of either of these) for the samples to plotparam_sets – A list of triplets of parameter names to plot [(x,y, color), (x2,y2,color2)..]
nx – number of subplots per row
legend_labels – list of legend labels
kwargs – keyword arguments for
plot_3d()
- Returns:
The plot_col, plot_row subplot dimensions of the new figure
from getdist import plots, gaussian_mixtures
samples1, samples2 = gaussian_mixtures.randomTestMCSamples(ndim=5, nMCSamples=2)
g = plots.get_subplot_plotter(subplot_size=4)
g.plots_3d([samples1, samples2], [['x0', 'x1', 'x2'], ['x3', 'x4', 'x2']], nx=2);
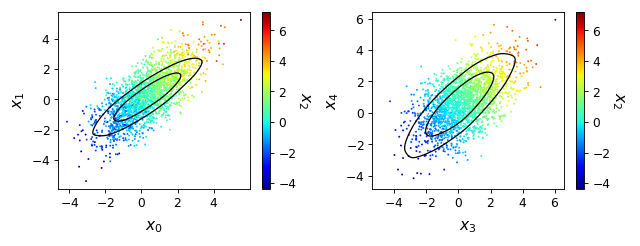
- plots_3d_z(roots, param_x, param_y, param_z=None, max_z=None, **kwargs)[source]
Make set of sample scatter subplots of param_x against param_y, each coloured by values of parameters in param_z (all if None). Any second or more samples in root are shown as contours.
- Parameters:
roots – root name or
MCSamplesinstance (or list of any of either of these) for the samples to plotparam_x – x parameter name
param_y – y parameter name
param_z – list of parameter to names to color samples in each subplot (default: all)
max_z – The maximum number of z parameters we should use.
kwargs – keyword arguments for
plot_3d()
- Returns:
The plot_col, plot_row subplot dimensions of the new figure
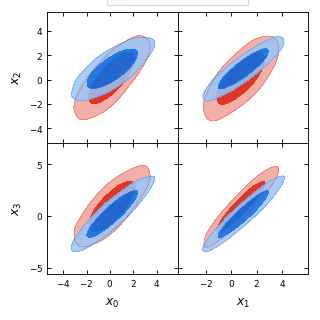
- rectangle_plot(xparams, yparams, yroots=None, roots=None, plot_roots=None, plot_texts=None, xmarkers=None, ymarkers=None, marker_args=mappingproxy({}), param_limits=mappingproxy({}), legend_labels=None, legend_ncol=None, label_order=None, **kwargs)[source]
Make a grid of 2D plots.
A rectangle plot shows all x parameters plotted againts all y parameters in a grid of subplots with no spacing.
Set roots to use the same set of roots for every plot in the rectangle, or set yroots (list of list of roots) to use different set of roots for each row of the plot; alternatively plot_roots allows you to specify explicitly (via list of list of list of roots) the set of roots for each individual subplot.
- Parameters:
xparams – list of parameters for the x axes
yparams – list of parameters for the y axes
yroots – (list of list of roots) allows use of different set of root names for each row of the plot; set either roots or yroots
roots – list of root names or
MCSamplesinstances. Uses the same set of roots for every plot in the rectangle; set either roots or yroots.plot_roots – Allows you to specify (via list of list of list of roots) the set of roots for each individual subplot
plot_texts – a 2D array (or list of lists) of a text label to put in each subplot (use a None entry to skip one)
xmarkers – optional dict giving vertical marker values indexed by parameter, or a list of marker values for each x parameter plotted
ymarkers – optional dict giving horizontal marker values indexed by parameter, or a list of marker values for each y parameter plotted
marker_args – arguments for
add_x_marker()andadd_y_marker()param_limits – a dictionary holding a mapping from parameter names to axis limits for that parameter
legend_labels – list of labels for the legend
legend_ncol – The number of columns for the legend
label_order – minus one to show legends in reverse order that lines were added, or a list giving specific order of line indices
kwargs – arguments for
plot_2d().
- Returns:
the 2D list of
Axescreated
from getdist import plots, gaussian_mixtures
samples1, samples2 = gaussian_mixtures.randomTestMCSamples(ndim=4, nMCSamples=2)
g = plots.get_subplot_plotter()
g.rectangle_plot(['x0','x1'], ['x2','x3'], roots = [samples1, samples2], filled=True)
- rotate_xticklabels(ax=None, rotation=90, labelsize=None)[source]
Rotates the x-tick labels by given rotation (degrees)
- Parameters:
ax – optional
Axesinstance (or y,x subplot coordinate) to add to (defaults to current plot or the first/main plot if none)rotation – How much to rotate in degrees.
labelsize – size for tick labels (default from settings.axes_fontsize)
- rotate_yticklabels(ax=None, rotation=90, labelsize=None)[source]
Rotates the y-tick labels by given rotation (degrees)
- Parameters:
ax – optional
Axesinstance (or y,x subplot coordinate) to add to (defaults to current plot or the first/main plot if none)rotation – How much to rotate in degrees.
labelsize – size for tick labels (default from settings.axes_fontsize)
- samples_for_root(root, file_root=None, cache=True, settings=None)[source]
Gets
MCSamplesfrom root name (or just return root if it is already an MCSamples instance).- Parameters:
root – The root name (without path, e.g. my_chains)
file_root – optional full root path, by default searches in self.chain_dirs
cache – if True, return cached object if already loaded
settings – optional dictionary of settings to use
- Returns:
MCSamplesfor the given root name
- set_axes(params=(), lims=None, do_xlabel=True, do_ylabel=True, no_label_no_numbers=False, pos=None, color_label_in_axes=False, ax=None, **_other_args)[source]
Set the axis labels and ticks, and various styles. Do not usually need to call this directly.
- Parameters:
params – [x,y] list of the
ParamInfofor the x and y parameters to use for labelslims – optional [xmin, xmax, ymin, ymax] to fix specific limits for the axes
do_xlabel – True to include label for x-axis.
do_ylabel – True to include label for y-axis.
no_label_no_numbers – True to hide tick labels
pos – optional position of the axes [‘left’ | ‘bottom’ | ‘width’ | ‘height’]
color_label_in_axes – If True, and params has at last three entries, puts text in the axis to label the third parameter
ax – optional
Axesinstance (or y,x subplot coordinate) to add to (defaults to current plot or the first/main plot if none)_other_args – Not used, just quietly ignore so that set_axes can be passed general kwargs
- Returns:
an
Axesinstance
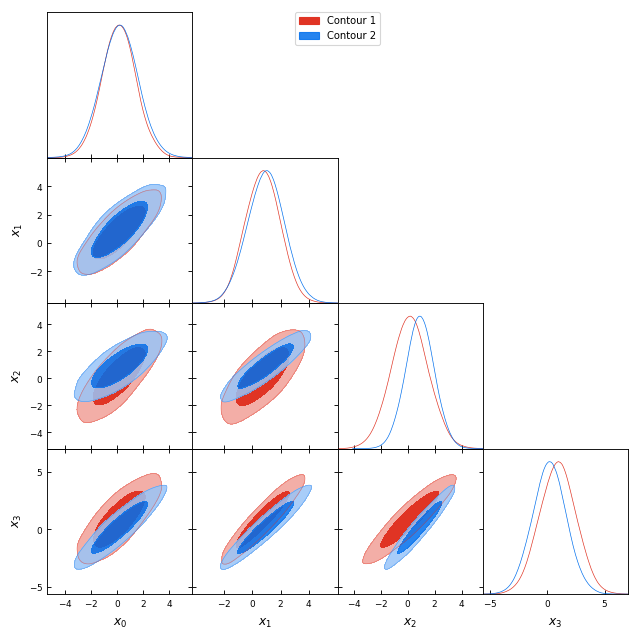
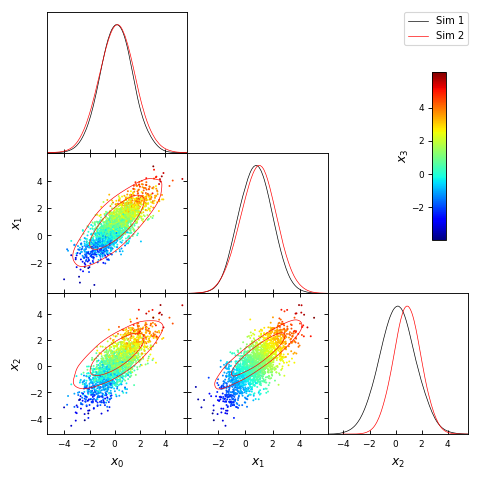
- triangle_plot(roots, params=None, legend_labels=None, plot_3d_with_param=None, filled=False, shaded=False, contour_args=None, contour_colors=None, contour_ls=None, contour_lws=None, line_args=None, label_order=None, legend_ncol=None, legend_loc=None, title_limit=None, upper_roots=None, upper_kwargs=mappingproxy({}), upper_label_right=False, diag1d_kwargs=mappingproxy({}), markers=None, marker_args=mappingproxy({}), param_limits=mappingproxy({}), **kwargs)[source]
Make a trianglular array of 1D and 2D plots. Also known as corner plot.
A triangle plot is an array of subplots with 1D plots along the diagonal, and 2D plots in the lower corner. The upper triangle can also be used by setting upper_roots.
- Parameters:
roots – root name or
MCSamplesinstance (or list of any of either of these) for the samples to plot. Can also contain a theoryMixtureND(e.g. GaussianND, useful for Fisher forecasts)params – list of parameters to plot (default: all, can also use glob patterns to match groups of parameters)
legend_labels – list of legend labels
plot_3d_with_param – for the 2D plots, make sample scatter plot, with samples colored by this parameter name (to make a ‘3D’ plot)
filled – True for filled contours
shaded – plot shaded density for first root (cannot be used with filled) unless specified otherwise
contour_args – optional dict (or list of dict) with arguments for each 2D plot (e.g. specifying color, alpha, etc)
contour_colors – list of colors for plotting contours (for each root)
contour_ls – list of Line styles for 2D unfilled contours (for each root)
contour_lws – list of Line widths for 2D unfilled contours (for each root)
line_args – dict (or list of dict) with arguments for each 2D plot (e.g. specifying ls, lw, color, etc)
label_order – minus one to show legends in reverse order that lines were added, or a list giving specific order of line indices
legend_ncol – The number of columns for the legend
legend_loc – The location for the legend (e.g. ‘upper center’, etc.)
title_limit – if not None, a maginalized limit (1,2..) to print as the title of the first root on the diagonal 1D plots
upper_roots – set to fill the upper triangle with subplots using this list of sample root names
upper_kwargs – dict for same-named arguments for use when making upper-triangle 2D plots (contour_colors, etc). Set show_1d=False to not add to the diagonal.
upper_label_right – when using upper_roots whether to label the y axis on the top-right axes (splits labels between left and right, but avoids labelling 1D y axes top left)
diag1d_kwargs – list of dict for arguments when making 1D plots on grid diagonal
markers – optional dict giving marker values indexed by parameter, or a list of marker values for each parameter plotted. Can have list values for multiple markers for each parameter.
marker_args – dictionary of optional arguments for adding markers (passed to axvline and/or axhline), or list of dictionaries when multiple marker values are given for each parameter.
param_limits – a dictionary holding a mapping from parameter names to axis limits for that parameter
kwargs – optional keyword arguments for
plot_2d()orplot_3d()(lower triangle only)
from getdist import plots, gaussian_mixtures
samples1, samples2 = gaussian_mixtures.randomTestMCSamples(ndim=4, nMCSamples=2)
g = plots.get_subplot_plotter()
g.triangle_plot([samples1, samples2], filled=True, legend_labels = ['Contour 1', 'Contour 2'])
from getdist import plots, gaussian_mixtures
samples1, samples2 = gaussian_mixtures.randomTestMCSamples(ndim=4, nMCSamples=2)
g = plots.get_subplot_plotter()
g.triangle_plot([samples1, samples2], ['x0','x1','x2'], plot_3d_with_param='x3')
- class getdist.plots.MCSampleAnalysis(chain_locations: str | Iterable[str], settings: str | dict | IniFile = None)[source]
A class that loads and analyses samples, mapping root names to
MCSamplesobjects with caching. Typically accessed as the instance stored in plotter.sample_analyser, for example to get anMCSamplesinstance from a root name being used by a plotter, use plotter.sample_analyser.samples_for_root(name).- Parameters:
chain_locations – either a directory or the path of a grid of runs; it can also be a list of such, which is searched in order
settings – Either an
IniFileinstance, the name of an .ini file, or a dict holding sample analysis settings.
- add_chain_dir(chain_dir)[source]
Adds a new chain directory or grid path for searching for samples
- Parameters:
chain_dir – The root directory to add
- add_root(file_root)[source]
Add a root file for some new samples
- Parameters:
file_root – Either a file root name including path or a
RootInfoinstance- Returns:
MCSamplesinstance for given root file.
- add_roots(roots)[source]
A wrapper for add_root that adds multiple file roots
- Parameters:
roots – An iterable containing filenames or
RootInfoobjects to add
- bounds_for_root(root)[source]
Returns an object with get_upper/getUpper and get_lower/getLower to get hard prior bounds for given root name
- Parameters:
root – The root name to use.
- Returns:
object with get_upper() or getUpper() and get_lower() or getLower() functions
- get_density(root, param, likes=False)[source]
Get
Density1Dfor given root name and parameter- Parameters:
root – The root name of the samples to use
param – name of the parameter
likes – whether to include mean likelihood in density.likes
- Returns:
Density1Dinstance with 1D marginalized density
- get_density_grid(root, param1, param2, conts=2, likes=False)[source]
Get 2D marginalized density for given root name and parameters
- Parameters:
root – The root name for samples to use.
param1 – x parameter
param2 – y parameter
conts – number of contour levels (up to maximum calculated using contours in analysis settings)
likes – whether to include mean likelihoods
- Returns:
Density2Dinstance with marginalized density
- load_single_samples(root)[source]
Gets a set of unit weight samples for given root name, e.g. for making sample scatter plot
- Parameters:
root – The root name to use.
- Returns:
array of unit weight samples
- params_for_root(root, label_params=None)[source]
Returns a
ParamNameswith names and labels for parameters used by samples with a given root name.- Parameters:
root – The root name of the samples to use.
label_params – optional name of .paramnames file containing labels to use for plots, overriding default
- Returns:
ParamNamesinstance
- remove_root(root)[source]
Remove a given root file (does not delete it)
- Parameters:
root – The root name to remove
- reset(settings=None, chain_settings_have_priority=True)[source]
Resets the caches, starting afresh optionally with new analysis settings
- Parameters:
settings – Either an
IniFileinstance, the name of an .ini file, or a dict holding sample analysis settings.chain_settings_have_priority – whether to prioritize settings saved with the chain
- samples_for_root(root: str | MCSamples, file_root: str | None = None, cache=True, settings: Mapping[str, Any] | None = None)[source]
Gets
MCSamplesfrom root name (or just return root if it is already an MCSamples instance).- Parameters:
root – The root name (without path, e.g. my_chains)
file_root – optional full root path, by default searches in self.chain_dirs
cache – if True, return cached object if already loaded
settings – optional dictionary of settings to use
- Returns:
MCSamplesfor the given root name
- getdist.plots.add_plotter_style(name, cls, activate=False)[source]
Add a plotting style, consistenting of style name and a class type to use when making plotter instances.
- Parameters:
name – name for the style
cls – a class inherited from
GetDistPlotteractivate – whether to make it the active style
- getdist.plots.get_plotter(style: str | None = None, **kwargs)[source]
Creates a new plotter and returns it
- Parameters:
style – name of a plotter style (associated with custom plotter class/settings), otherwise uses active
kwargs – arguments for the style’s
GetDistPlotter
- Returns:
The
GetDistPlotterinstance
- getdist.plots.get_single_plotter(ratio: float | None = None, width_inch: float | None = None, scaling: bool | None = None, rc_sizes=False, style: str | None = None, **kwargs)[source]
Get a
GetDistPlotterfor making a single plot of fixed width.For a half-column plot for a paper use width_inch=3.464.
Use this or
get_subplot_plotter()to make aGetDistPlotterinstance for making plots. This function will use the active style by default, which will determine defaults for the various optional parameters (seeset_active_style()).- Parameters:
ratio – The ratio between height and width.
width_inch – The width of the plot in inches
scaling – whether to scale down fonts and line widths for small subplot axis sizes (relative to reference sizes, 3.5 inch)
rc_sizes – set default font sizes from matplotlib’s current rcParams if no explicit settings passed in kwargs
style – name of a plotter style (associated with custom plotter class/settings), otherwise uses active
kwargs – arguments for
GetDistPlotter
- Returns:
The
GetDistPlotterinstance
- getdist.plots.get_subplot_plotter(subplot_size: float | None = None, width_inch: float | None = None, scaling: bool | None = None, rc_sizes=False, subplot_size_ratio: float | None = None, style: str | None = None, **kwargs) GetDistPlotter[source]
Get a
GetDistPlotterfor making an array of subplots.If width_inch is None, just makes plot as big as needed for given subplot_size, otherwise fixes total width and sets default font sizes etc. from matplotlib’s default rcParams.
Use this or
get_single_plotter()to make aGetDistPlotterinstance for making plots. This function will use the active style by default, which will determine defaults for the various optional parameters (seeset_active_style()).- Parameters:
subplot_size – The size of each subplot in inches
width_inch – Optional total width in inches
scaling – whether to scale down fonts and line widths for small sizes (relative to reference sizes, 3.5 inch)
rc_sizes – set default font sizes from matplotlib’s current rcParams if no explicit settings passed in kwargs
subplot_size_ratio – ratio of height to width for subplots
style – name of a plotter style (associated with custom plotter class/settings), otherwise uses active
kwargs – arguments for
GetDistPlotter
- Returns:
The
GetDistPlotterinstance
- getdist.plots.set_active_style(name=None)[source]
Set an active style name. Each style name is associated with a
GetDistPlotterclass used to generate plots, with optional custom plot settings and rcParams. The corresponding style module must have been loaded before using this.Note that because style modules can change rcParams, which is a global parameter, in general style settings are changed globally until changed back. But if your style does not change rcParams then you can also just pass a style name parameter when you make a plot instance.
The supplied example styles are ‘default’, ‘tab10’ (default matplotlib color scheme) and ‘planck’ (more compilcated example using latex and various customized settings). Use
add_plotter_style()to add your own style class.- Parameters:
name – name of the style, or none to revert to default
- Returns:
the previously active style name